How to Test the Price Elasticity of Smoking Cessation Courses and Find the Optimal Profit Range
At 11:20 PM on March 12, 2024, I stood outside a 24-hour convenience store in Nanshan, Shenzhen, editing the landing page price, changing the 21-day smoking cessation companion course from ¥399 to ¥599. The reason was simple: some competitors were selling at 1280, and I feared that "selling cheap would seem unprofessional." The next day, Moments + Video Channel private messages totaled about 86 valid inquiries, with 4 orders paid. Based on the same traffic metrics from the previous week, the 399 price point would have yielded about 9–11 orders. My gut feeling was "a bit more expensive is fine, the prestige is up."
It wasn't until March 28 when I reconciled accounts that I realized something was wrong. In those two weeks at 599, there were 2 refund requests (1 of which gave up on day 5), and the average customer service WeChat conversation time stretched from 18 minutes to 27 minutes—users' expectations of "if it's expensive, I'll hold you more accountable" skyrocketed. Rough net profit for the two weeks:
Conversion dropped by more than half, unit price increased by 50%, but profits were cut in half. After that experience, I stopped believing that "smoking cessation courses should be priced high" and began systematically testing price elasticity. Below is a method I later developed: simple, accountable, and able to explain "why this price is the most profitable."
1. Making Concepts Clear: What Does "Price Elasticity" for Smoking Cessation Courses Really Measure?
Price Elasticity of Demand measures: When the price changes by 1%, roughly what percentage does demand change? Simplified formula:
\\[
E \approx \frac{(Q_2 - Q_1)/Q_1}{(P_2 - P_1)/P_1}
\\]
A smoking cessation course is not a cola, nor is it pure SaaS software. What users buy is the hope of "can I quit this time" + a support structure + the expectation of a fallback if they fail. So you'll see a strange phenomenon:
My view: Smoking cessation courses have at least two elasticity zones. The low-price zone tests "willingness to try"; the mid-to-high price zone tests "whether you're seen as an accountable service provider." The latter's elasticity curve is often steeper and raises delivery costs—looking only at conversion without considering after-sales will yield a falsely optimal price.
Among public methodologies, Stripe and others call "gradually adjusting prices and observing sales" price elasticity testing, using A/B splitting to reduce misjudgment; Van Westendorp (PSM) uses questionnaires to find "acceptable price ranges." These tools are useful, but willingness-to-pay in surveys is systematically higher than actual out-of-pocket spending—especially for a category like smoking cessation, where "I know I should quit, but my wallet and willpower are out of sync." Surveys can set a range but cannot determine the final transaction price.
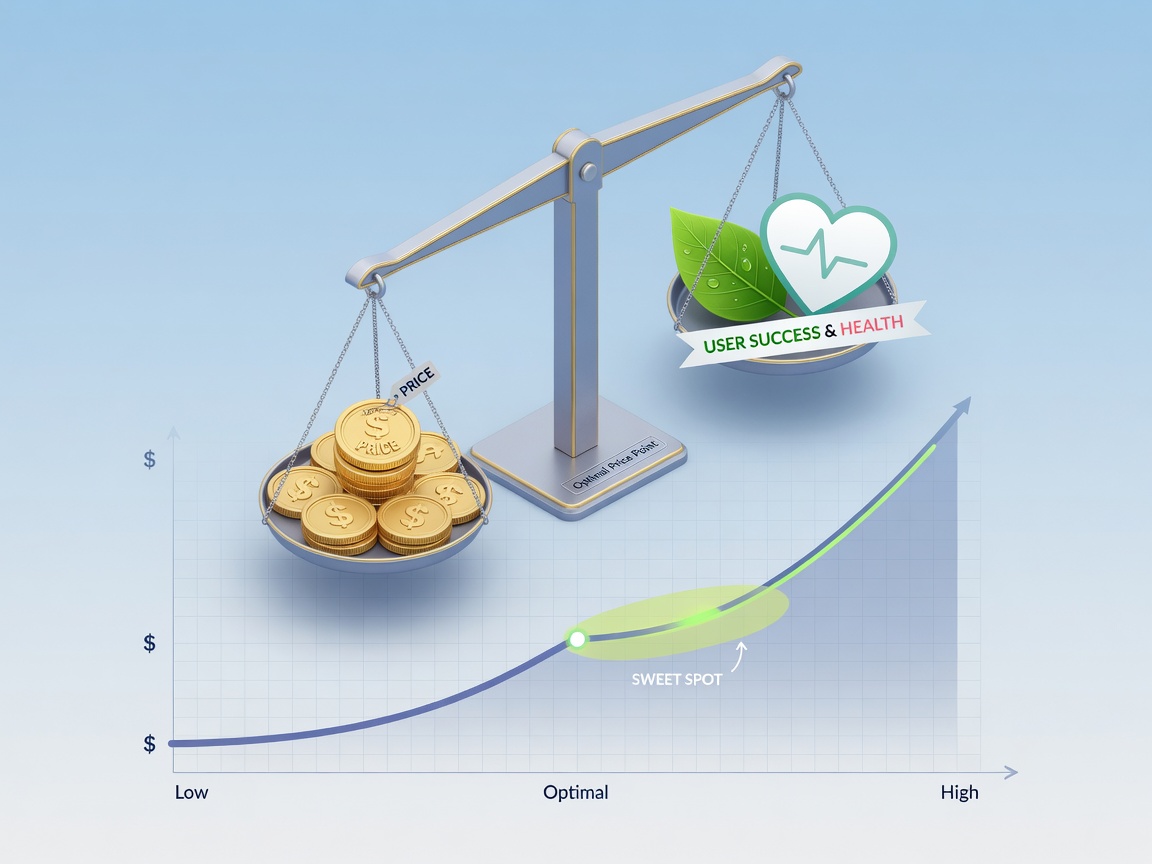
2. Optimal Profit ≠ Highest Conversion: Write Down the Formula First, Then Test
Many people only focus on conversion rate when testing prices. A smoking cessation course requires at least this simplified profit function:
\\[
\pi(P) = N \cdot c(P) \cdot \big[P \cdot (1 - r(P)) - D(P)\big] - F
\\]
Symbol explanation (based on my own bookkeeping habits):
| Symbol | Meaning | Typical Data Source |
|---|---|---|
| \\(N\\) | Effective exposures/inquiries in the period | Landing page UV or private domain reach |
| \\(c(P)\\) | Conversion rate (varies with price) | Orders/inquiries or Orders/UV |
| \\(P\\) | Listed price | The price you set |
| \\(r(P)\\) | Refund rate (often rises with price) | Refund orders/total orders |
| \\(D(P)\\) | Per-unit variable delivery cost | Labor follow-up, SMS, materials, community ops allocation |
| \\(F\\) | Fixed costs for the period | Ad spend, tool subscriptions, coach base salary |
Key judgment:
The price with the highest conversion is often suboptimal or even the worst for profit. At 399, conversion is high, but if your delivery involves "15 minutes of 1-on-1 voice daily," too many people will collapse your delivery, and both reputation and refunds will blow up. The optimal profit range is the price segment where \\pi\ is maximized while \c(P)\, \r(P)\, and \D(P)\ all move together—not some "magic integer."
My own empirical thresholds (small team, 200–400 monthly inquiries):
3. Three Testing Methods: From Cheap to Expensive, Sorted by Risk
Method A: Four-Question Survey (Van Westendorp / PSM) — A Sketch in 2 Days
The price sensitivity test proposed by Van Westendorp in 1976 centers on four threshold questions. I adapted them to the smoking cessation course context, sending them to people who inquired within the last 30 days but didn't purchase, as well as existing students (calculated separately for the two groups):
Operational details (a version I ran in April 2024 using Survey Star within WeChat):
Personal view: PSM is good for answering "don't be stupid enough to set 29 or 2999," but not for directly using the OPP as the listed price. Non-purchasing users will deliberately fill in low numbers; existing users will fill in high numbers. I only used it to lock in test candidate prices: 249 / 349 / 449 / 549 four points, then entered real transaction testing.
Method B: Stepped Pricing + Time Window — Testing Without Split Tools
From May 6 to May 27, 2024, on the same landing page linked from my Video Channel bio, I changed prices by natural week (not parallel A/B, suitable for teams without technical resources):
| Week | Price | Valid Inquiries | Orders | Conversion | Refunds | Est. Net Profit* |
|---|---|---|---|---|---|---|
| W1 | 249 | 41 | 14 | 34.1% | 0 | ≈ 2900 |
| W2 | 349 | 38 | 11 | 28.9% | 0 | ≈ 3200 |
| W3 | 449 | 36 | 7 | 19.4% | 1 | ≈ 2100 |
| W4 | 399 (rollback) | 40 | 10 | 25.0% | 0 | ≈ 3100 |
\*Net profit estimated as: revenue − refunds − per-unit delivery cost of 70 yuan, excluding ad spend (that month relied mainly on organic traffic).
How to read:
Two pitfalls I encountered with the stepped method:
Method C: True A/B Split — Only When Sample Size Is Sufficient
When your weekly valid inquiries are consistently ≥80, or paid ad spend reaches ≥300 yuan/day, then parallel price A/B testing is cleaner. The approach is similar to SaaS price testing: the same landing page randomly shows price A/B, with all other copy, selling points, and guarantee terms identical—only the price and payment button change.
My simplest version from September 2024 (no complex middleware):
Feeding back into the formula (using inquiries as a demand proxy):
\\[
E \approx \frac{(11-15)/15}{(449-399)/399} \approx \frac{-0.267}{0.125} \approx -2.1
\\]
Interpretation: In the small step from 399→449, demand is quite elastic (|E|≈2.1). Unit price rose 12.5%, but transaction volume dropped about 27%, so total revenue likely didn't increase—and after accounting for refunds, it was even worse. So I removed 449 as a main price point, presenting it only as an upgrade package "including 1 extended review call" — this is called changing the product boundary, healthier than a naked price increase.
The industry also often mentions compliance and trust issues with price A/B testing: the test window should be short, unify the price after winning, and don't create noise by compensating test-period buyers afterward. Smoking cessation courses have an additional rule: guarantee scripts must be equal for equal prices; high-pressure groups cannot promise "guaranteed quitting," otherwise you're not measuring price elasticity but promise elasticity.
4. Minimum Data Table: You Only Need These 8 Columns
I now force myself to fill in this table for every test cycle (Google Sheet / Feishu both work):
Three advanced columns (add if you have capacity):
Three common misreadings of false elasticity:
My hard rule: Any price point's conclusion must cover at least 1 full delivery week + 3 days of refund observation window.
5. How to Move from Numbers to "Optimal Profit Range"
Don't chase a single magic number; chase a plateau. The decision tree I actually use:
For each candidate price P:
  Calculate π(P), and calculate Δπ from adjacent prices
  If π is highest and |Δπ| is within ±8% → include in "optimal profit plateau"
  If higher price π is slightly higher but r rises and completion rate falls → deprioritize (reputation debt)
  If lower price π is high but delivery person-days are maxed → limit sales or raise price (capacity constraint)
Combining data from previous rounds, the structure I set for my 21-day companion course is:
| Tier | Price | Role |
|---|---|---|
| Experience Camp (3 days) | 49–99 | Test willingness, filter freeloaders, not bearing main profit |
| Standard 21-day | **369–399** | Main push; profit plateau |
| With 1 deep review session | 499–549 | Use "added service" to capture high willingness-to-pay, rather than nakedly raising the standard version |
| Corporate/Partner Dual | Separate case | Small sample, no public A/B |
Why not the PSM's 299?
Because at 299, inquiries were flooded with "just browsing" people, average delivery minutes increased, completion rate dropped below 40%, and community atmosphere became noisy. The profit statement looked good for a month or two, but in the third month, repurchase and referrals collapsed. Optimal profit must include "can we still acquire customers at the same cost next month" — this factor is hard to put into a single-period formula, but I use referral share as a proxy: when the standard price stabilized around 379, referrals accounted for about 18% of orders; when dropped to 249, it fell to around 9%.
6. Delivery Costs and Refunds: Build Them into Elasticity, Not Treat Them as Accidents
The \D(P)\ of a smoking cessation course is not constant. The higher the price, the more users treat you like a "rehabilitation institution":
If you estimate coach time at 80 yuan/hour, the per-person labor cost difference in the high-price group can reach 50–80 yuan. Hence:
\\[
\text{Nominal contribution} = P(1-r) - D_0
\quad vs \quad
\text{Real contribution} = P(1-r) - D(P)
\\]
People who only optimize nominal contribution will systematically set prices one tier too high.
Refund policy wording also affects \r(P)\. I tried two approaches:
Personal stance: For a strong-willpower category like smoking cessation, extremely lenient refund policies attract "buying psychological comfort" orders—short-term conversion looks good, but long-term it burns out the coach. Price testing must be tied to refund rules; changing prices without changing rules makes experiments incomparable.
7. A Replicable 14-Day Test Schedule (One Person Can Run It)
Day 0 (Preparation)
Days 1–2
Days 3–9
Days 10–12
Days 13–14
Sample size experience: each price point needs ≥10 orders or ≥40 valid inquiries for direction to be barely reliable; less than that can only serve as qualitative signals. Small teams should focus not on statistical perfection but on multiple short rounds of testing with consistent standard review.
8. Where I Ultimately Stand
If you currently have only one price, have never tracked refunds and delivery minutes, you don't need complex infrastructure. Starting this month: fix your scripts, change one price, fill in 8 columns for 14 days. After two rounds, your judgment of "what our course is worth" will be stronger than reading ten pricing articles.
Price elasticity is not meant to prove how expensive you are; it's meant to find the narrow gate where users still feel it's fair, you still make money, and the team can still sleep well. Once you find that narrow gate, put your energy back into check-in design, relapse management, and content trust — that's the true moat of a smoking cessation course.
* Net profit estimated as: revenue − refunds − per-unit delivery cost of 70 yuan, excluding ad spend